What type of maps can be generated

Maps
Gene expression maps
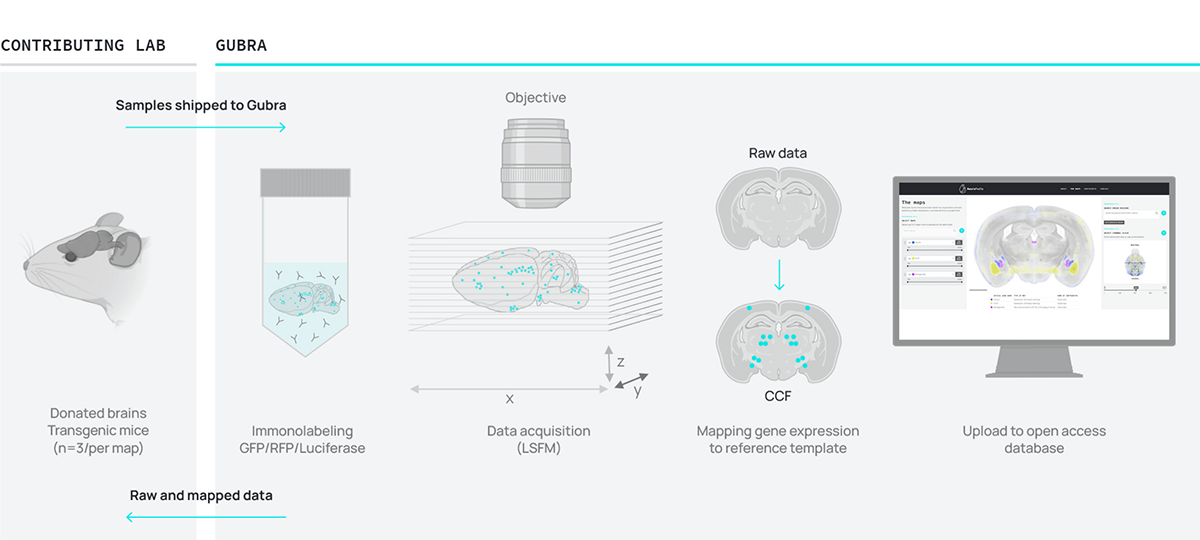
Most of the maps in NeuroPedia are expression maps visualising the expression of a given gene in the mouse brain. These maps are generated by staining for transgenic markers such as GFP, Tomato, Luciferase or validated commercial antibodies. Each map is typically based on an average map derived from 3-8 individual mouse brains. If the expression is defined by structures that vary from brain to brain, for example the vasculature, the expression maps are generated from one brain to provide better resolution.
Connectivity maps
It is possible to upload connectivity maps to NeuroPedia visualising the projections of neuronal subpopulations within the CNS or neuronal connections from the peripheral tissues using transsynaptic labelling. These maps are generated by staining for GFP and other transgenic markers. Connectivity maps are typically based on an average map of three individual brains.
Neural activation maps
Neuronal activation maps, such as c-Fos or other activity markers, can be uploaded to NeuroPedia. In that case, maps will be generated with z-score where the final map is a voxel based statistical comparison between the treatment group to the control group. Typically, these datasets are generated from larger studies containing six to eight animals per group.
